

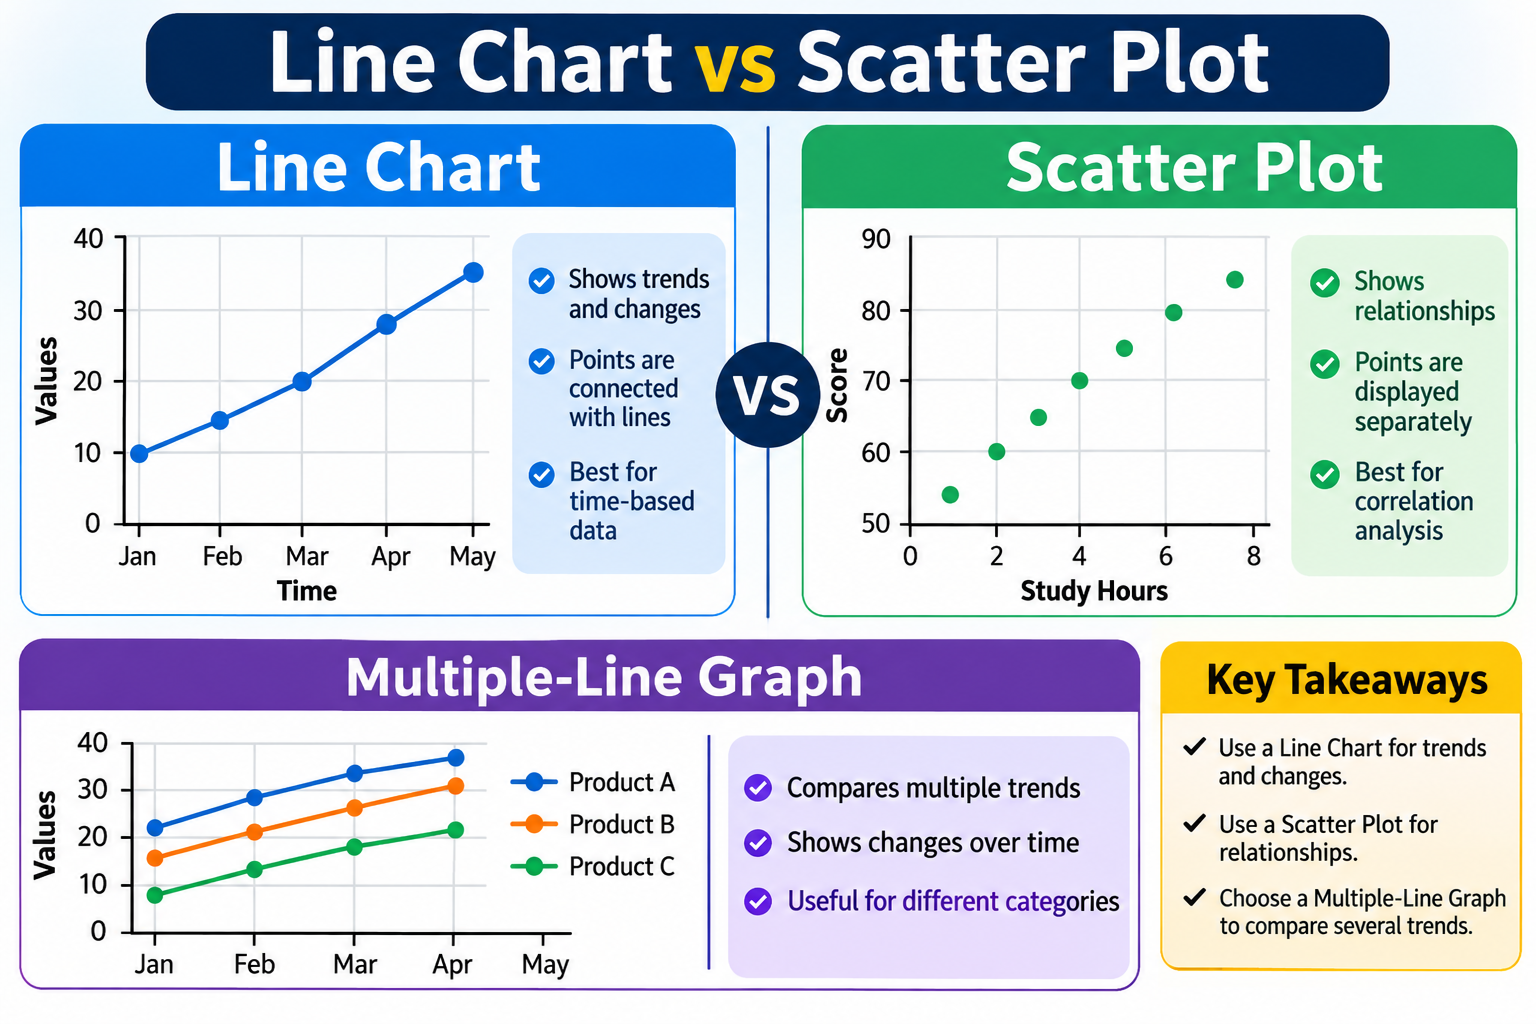
What Is the Difference Between a Line Chart vs Scatter Plot, and When Should You Use Each?

Data visualization makes it easier to understand information, identify patterns, and compare different values. Two popular ways to display numerical data are line charts and scatter plots. Although they may look similar because both use points and coordinate axes, they serve different purposes.
Understanding Line Chart vs Scatter Plot can help students, researchers, teachers, and business professionals select the right visualization for their data. Each chart has unique features, advantages, and applications that make it suitable for specific situations.
In this guide, we will explain how line charts and scatter plots work, their main differences, and when you should use each one.
What Is a Line Chart?
A Multiple-line graph is a type of graph that displays information using points connected by straight lines. It is commonly used to show changes in data over time or across an ordered sequence.
For example, a business might use a line chart to track monthly sales throughout the year. By connecting the data points, viewers can easily understand whether sales are increasing, decreasing, or remaining stable.
Line charts are particularly useful when you want to identify trends and observe changes between different periods.
Common uses of line charts include:
-
Tracking monthly or yearly sales.
-
Monitoring temperature changes.
-
Comparing website traffic over time.
-
Measuring business performance.
-
Showing population growth.
-
Analyzing financial trends.
A line chart provides a simple way to understand how values change from one point to another.
What Is a Scatter Plot?
A scatter plot is a graph that displays individual data points on a horizontal X-axis and a vertical Y-axis. Each point represents a pair of numerical values.
Unlike a line chart, a scatter plot usually does not connect the points with lines. Instead, it shows how two variables are related.
For example, a researcher might compare students' study hours with their examination scores. Each student would appear as an individual point on the graph.
The arrangement of these points can reveal whether the variables have a positive relationship, negative relationship, or no clear relationship.
Common uses of scatter plots include:
-
Studying relationships between two variables.
-
Comparing height and weight measurements.
-
Analyzing advertising costs and sales.
-
Investigating temperature and electricity usage.
-
Identifying unusual data points.
-
Understanding scientific measurements.
Scatter plots are especially useful when the main goal is to discover relationships and correlations between numerical variables.
Line Chart vs Scatter Plot: Main Differences
Although both visualizations use horizontal and vertical axes, their purposes and presentation styles are different.
Here are the main differences to understand:
|
Feature |
Line Chart |
Scatter Plot |
|
Main purpose |
Shows trends and changes |
Shows relationships between variables |
|
Data points |
Usually connected with lines |
Usually displayed separately |
|
X-axis |
Often represents time or an ordered category |
Represents numerical values |
|
Y-axis |
Displays measured values |
Displays a second numerical variable |
|
Main focus |
Movement and trends |
Correlation and distribution |
|
Best application |
Time-based data |
Relationship analysis |
|
Outliers |
Can be identified |
Easy to identify visually |
The most important difference is how the data is interpreted. A line chart emphasizes the direction of change, while a scatter plot focuses on the relationship between two numerical variables.
When Should You Use a Line Chart?
A line chart is the right choice when you want to explain how something changes over time or across an ordered sequence.
For example, imagine a company wants to compare its monthly revenue from January to December. A line chart can connect each month's revenue and make the overall trend easy to understand.
You should consider using a line chart in the following situations:
1. Tracking Changes Over Time
Line charts are excellent for displaying daily, weekly, monthly, or yearly information. They help viewers understand how values change during different periods.
2. Comparing Multiple Data Series
If you want to compare several categories, you can use a multiple-line graph. It displays multiple lines on the same set of axes, allowing viewers to compare different trends.
For example, a business could use separate lines to compare the monthly sales performance of three products.
3. Identifying Trends
Line charts make it easier to identify upward trends, downward movements, and periods of stability.
4. Presenting Business Performance
Companies frequently use line charts to monitor revenue, expenses, customer growth, website visits, and other performance indicators.
When Should You Use a Scatter Plot?
A scatter plot is useful when you want to understand whether two numerical variables are connected.
For example, a school might investigate whether students who spend more time studying generally achieve higher examination scores.
Each student can be represented by one point. The overall distribution helps researchers understand the relationship between study time and academic performance.
Consider using scatter plots in these situations:
1. Examining Relationships
Scatter plots help identify whether two variables move together or in opposite directions.
2. Finding Correlations
They can reveal positive, negative, or weak relationships between numerical measurements.
3. Identifying Outliers
An outlier is a data point that appears far away from the general distribution. Scatter plots make unusual observations easier to recognize.
4. Supporting Scientific Research
Researchers use scatter plots to study relationships between measurements, conduct experiments, and explore patterns in collected data.
Can You Use a Multiple-Line Graph Instead of a Scatter Plot?
A multiple-line graph and a scatter plot can both display several data points, but they are not interchangeable.
A multiple-line graph is designed to compare changes across ordered categories or time periods. Each line represents a different data series.
For example, you could compare the monthly temperatures of three cities using separate lines.
A scatter plot, on the other hand, displays individual observations to investigate relationships between two numerical variables.
Here is a simple comparison:
-
Multiple-line graph: Best for comparing several trends over time.
-
Scatter plot: Best for exploring relationships between two numerical variables.
-
Line chart: Best for showing how one or more values change across an ordered sequence.
Choosing the right graph depends on your research question and the type of information you want to communicate.
Advantages of Line Charts
Line charts offer several benefits for data presentation.
-
Easy to understand: Most people can quickly interpret changes and trends.
-
Clear comparisons: Multiple data series can be displayed together.
-
Good for time-based information: They make changes across different periods visible.
-
Simple presentation: They can communicate large amounts of information without complicated explanations.
-
Useful for forecasting: Historical trends can help support future planning, although a chart alone does not establish a reliable forecast.
Advantages of Scatter Plots
Scatter plots also provide important benefits when analyzing numerical information.
-
Show relationships: They help reveal connections between two variables.
-
Identify patterns: Viewers can recognize clusters and distributions.
-
Highlight outliers: Unusual observations are easy to notice.
-
Support research: They are useful for statistical and scientific analysis.
-
Explore correlations: They help identify possible positive and negative relationships.
However, remember that correlation does not automatically mean causation. Two variables may be related without one directly causing changes in the other.
Common Mistakes When Choosing Between These Charts
Selecting the wrong visualization can make information confusing or misleading. Here are some common mistakes to avoid:
1. Connecting Unrelated Data Points
Connecting every point with a line is not always appropriate. If your goal is to examine relationships between independent numerical observations, a scatter plot is usually more suitable.
2. Using a Scatter Plot for Every Trend
When your information follows an ordered timeline, a line chart often communicates the overall movement more clearly.
3. Ignoring Axis Labels
Always provide clear axis titles and units. Without them, readers may misunderstand what the chart represents.
4. Adding Too Many Lines
A multiple-line graph can become difficult to read when it contains too many data series. Use clear labels and distinguishable line styles.
5. Assuming Correlation Means Causation
A scatter plot may show that two variables are associated, but further investigation is needed to establish whether one causes the other.
How to Create the Right Chart for Your Data
Creating an effective chart does not have to be difficult. Follow these simple steps:
-
Understand your data: Determine whether you are working with time-based information, ordered categories, or two numerical variables.
-
Define your objective: Decide whether you want to show changes, compare trends, or explore relationships.
-
Select the chart: Choose a line chart for trends or a scatter plot for relationships.
-
Organize your information: Arrange your numerical values correctly.
-
Label your axes: Include meaningful titles and measurement units.
-
Review the result: Make sure your visualization communicates the intended information clearly.
A reliable graphing tool can make this process easier by helping you organize data, customize chart styles, and present information in a readable format.
Conclusion
Understanding Line Chart vs Scatter Plot is important when selecting the right way to present numerical information. Although both charts use coordinate axes, they have different purposes.
A line chart is generally better for displaying trends and changes over time, while a scatter plot is more suitable for examining relationships between two numerical variables.
If you need to compare several trends, a multiple-line graph can also be a useful option. The best choice ultimately depends on your data, your research goals, and the message you want your audience to understand.
By selecting the appropriate chart, you can make complex information easier to interpret and communicate more effectively.
Frequently Asked Questions (FAQs)
1. What is the main difference between a line chart and a scatter plot?
A line chart connects data points to show trends and changes, usually over time. A scatter plot displays individual points to show relationships between two numerical variables.
2. Is a line chart better than a scatter plot?
Neither chart is universally better. A line chart is more suitable for showing trends, while a scatter plot is better for analyzing relationships and correlations.
3. Can a scatter plot have connecting lines?
Yes. Some scatter plots include connecting lines, but standard scatter plots usually display individual points without connecting them.
4. What type of data is best for a line chart?
Line charts work well with time-based or ordered data, such as monthly sales, daily temperatures, annual revenue, and population changes.
5. What does a scatter plot help you identify?
A scatter plot helps identify relationships, correlations, clusters, distributions, and unusual observations between two numerical variables.

