


Restaurant BI Tools for Chains: How Business Intelligence Improves Decision-Making
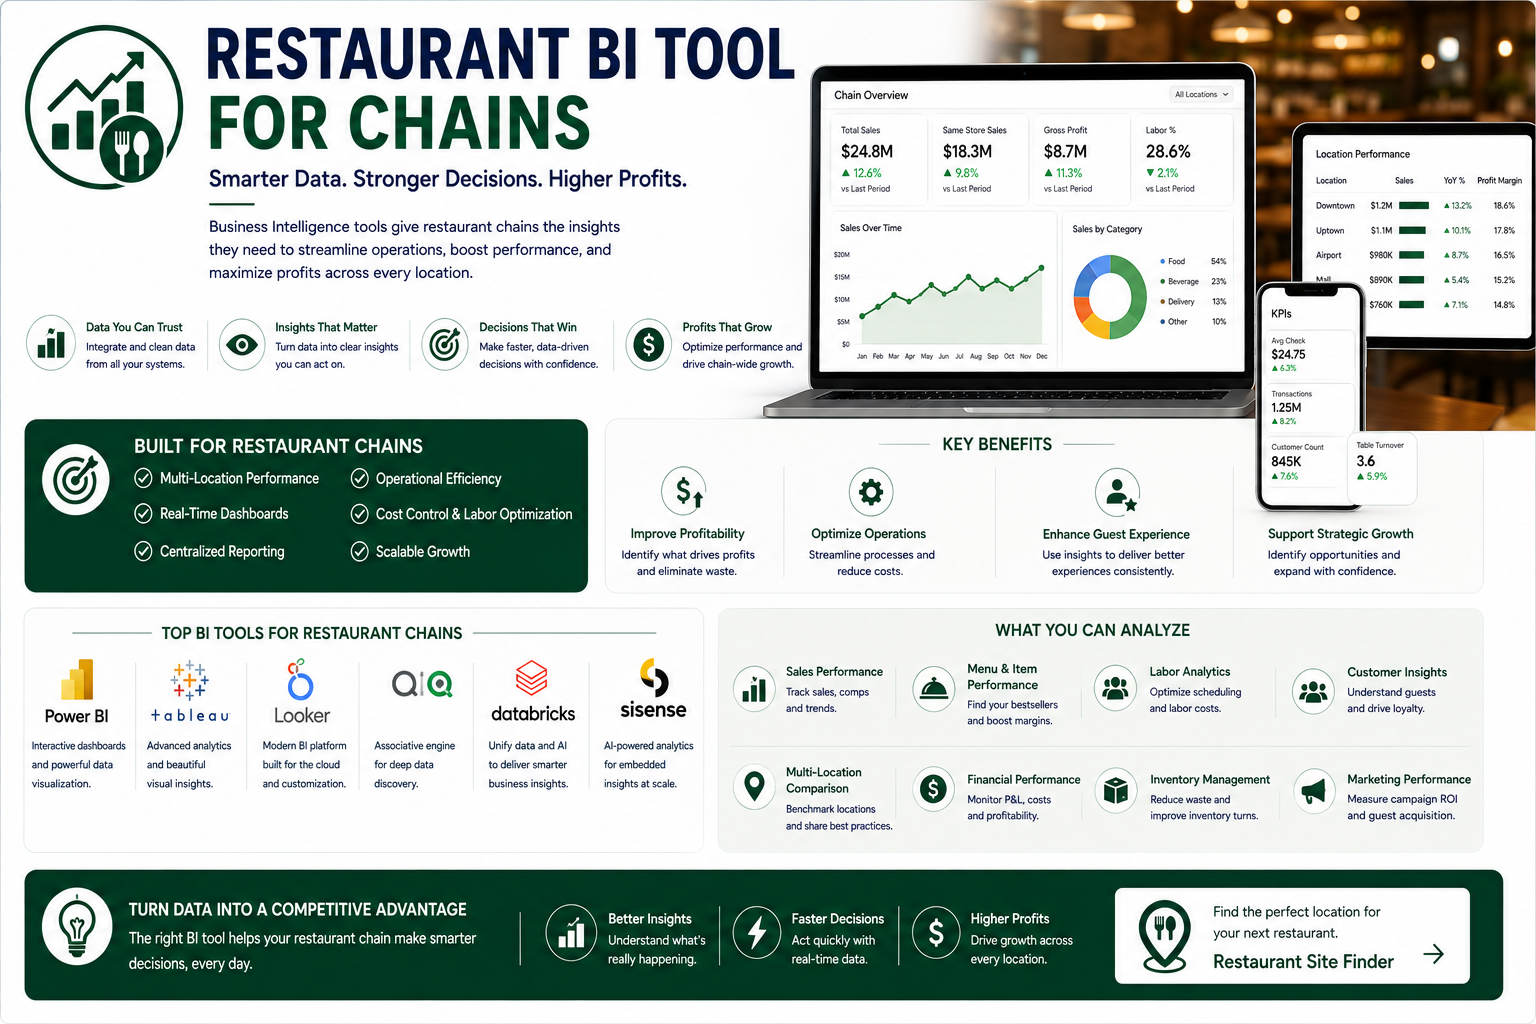
Restaurant BI Tools for Chains: How Business Intelligence Improves Decision-Making is an important topic for restaurant owners, operators, managers, and people evaluating the foodservice business. The phrase is often searched because people want a practical explanation rather than a vague industry claim. A useful guide should define the topic clearly, explain how it affects restaurant operations or financial decisions, and show how the information can be used in real planning. Because restaurant performance varies by concept, market, and operating model, the discussion below focuses on principles that can be applied to a specific business.
For readers researching restaurant bi tool for chains, the most useful approach is to connect the search topic with practical restaurant decisions.
What Restaurant Bi Means
Restaurant business intelligence, or BI, refers to tools and processes that turn operational data into reports, dashboards, trends, and actionable insights.
For a chain, BI can combine information from multiple locations so leadership can compare performance and identify patterns that may be difficult to see in separate spreadsheets.
Data Sources
Restaurant BI systems can draw from point-of-sale transactions, labor and scheduling systems, inventory, purchasing, accounting, online ordering, loyalty programs, delivery platforms, and customer feedback.
Connecting these sources can reduce manual reporting and provide a broader view of performance.
Multi-Unit Reporting
Chains need consistent reporting across locations.
BI can standardize definitions and display sales, labor, food cost, average check, transactions, and other metrics by restaurant, region, daypart, or period. Managers can then investigate why performance differs between otherwise similar locations.
Sales And Labor Analysis
Sales data can be compared with staffing levels to examine productivity, scheduling, and service capacity.
Managers can identify periods where labor appears misaligned with demand and test scheduling changes. The goal is not simply to reduce labor but to deploy the right resources when customers need them.
Inventory And Food Cost
BI can help connect purchasing, inventory, recipe costs, sales mix, and waste.
A chain may use these insights to identify unusual food-cost movement, supplier-price changes, or location-level variances. Better visibility can make corrective action faster.
Dashboards And Alerts
Dashboards summarize key metrics, while alerts can highlight unusual changes.
A regional manager might want to see sales trends, labor variance, food cost, guest feedback, or order accuracy. Alerts should be designed around actionable thresholds rather than generating excessive notifications.
Implementation Considerations
A BI project should start with clear business questions and reliable data.
Management should define metrics, data ownership, access controls, integration requirements, reporting frequency, and user training. Technology alone does not create better decisions; teams need a process for reviewing and acting on the information.
A Practical Way to Apply This Information
If you are researching restaurant bi tool for chains, start by documenting your current assumptions and then compare them with actual restaurant data. Define the objective, identify the relevant numbers, establish a review period, and record what changed. This turns general information into a repeatable management process.
For a new restaurant, the process can begin before opening. Build a basic operating model, estimate sales and costs, identify the biggest risks, and create a short list of metrics that will be reviewed every week or month. For an existing restaurant, use historical performance to establish a baseline and then test improvements one at a time.
It is also useful to separate leading indicators from lagging indicators. Sales and profit show what has already happened, while measures such as customer inquiries, reservations, staffing coverage, food waste, online conversion, or order accuracy can provide earlier signals. The right indicators depend on the concept and business model.
Questions Restaurant Owners Should Ask
· What assumption behind this topic is most important to our restaurant?
· Which data can we use to test that assumption?
· What costs, operational constraints, or customer behaviors could change the result?
· How often should management review the metric?
· What action will be taken if performance moves outside the expected range?
Conclusion
Restaurant BI Tools for Chains: How Business Intelligence Improves Decision-Making should be approached as a practical restaurant-management topic rather than as a single universal rule. Conditions differ between concepts, locations, service models, and stages of business development. The strongest approach is to understand the underlying principles, use reliable business data, and adapt the analysis to the restaurant being evaluated.
Tools and structured planning can make this process easier. Restaurant Site Finder provides resources designed around restaurant research, planning, analysis, and decision-making. Using the right information at the right stage can help restaurant owners turn broad questions into specific, measurable actions.
Additional Considerations
Restaurant decisions rarely depend on one variable. Sales, costs, customer demand, staffing, equipment, location, competition, and management systems interact. A change in one area can affect several others. For example, adding a menu item can increase sales while also increasing inventory complexity, prep labor, equipment use, and waste. That is why decisions should be evaluated from both revenue and operating perspectives.
Documentation is another important part of good restaurant management. When assumptions, formulas, definitions, and review periods are documented, different managers can interpret the same information consistently. This is especially valuable for growing businesses and restaurant groups where reporting needs to remain comparable across locations.
Finally, restaurant analysis should lead to action. If a metric is tracked but nobody is responsible for reviewing it or responding to changes, the information has limited practical value. Assign ownership, set review dates, and record decisions. Over time, this creates a feedback loop in which the restaurant learns from actual performance and improves its operating plan.
Another useful practice is to establish a clear baseline before making changes. Record the current sales pattern, major costs, customer behavior, staffing levels, and operational constraints. Once the baseline is documented, management can compare the result of a change with the previous period. This makes it easier to distinguish a genuine improvement from a temporary fluctuation caused by seasonality, promotions, weather, holidays, or unusual events.
Restaurant owners should also consider the relationship between customer experience and financial performance. A cost reduction that slows service or reduces product quality may create additional problems through refunds, poor reviews, lower repeat visits, or weaker demand. Effective management therefore looks for sustainable improvements that reduce waste and inefficiency without removing the elements customers value.
For growing restaurant businesses, standardization becomes increasingly important. Definitions for sales, labor, food cost, prime cost, customer counts, and other metrics should be consistent across periods and locations. Standard definitions make comparisons more meaningful and help management identify whether a result is caused by a local issue or a broader change in the business.
Finally, the best restaurant planning process is iterative. Initial projections are estimates, while actual operating data becomes available after launch. Owners should update forecasts, revise assumptions, and document lessons learned. This approach creates a practical feedback loop: plan, operate, measure, investigate, improve, and plan again. It is more useful than relying on a single statistic, formula, or benchmark without context.
Good reporting also requires consistent time periods. Comparing a busy holiday week with a normal week can distort conclusions. When possible, compare similar periods and consider seasonality. Restaurant demand can change because of weather, tourism, school calendars, local events, holidays, and promotional campaigns. Context should accompany every important performance number.
Management should avoid using a metric in isolation. Sales growth can look positive while margins decline, and lower labor cost can appear favorable while service quality suffers. Combining financial, operational, and customer measures creates a more balanced view of restaurant performance and helps decision-makers understand trade-offs.

 Bangla